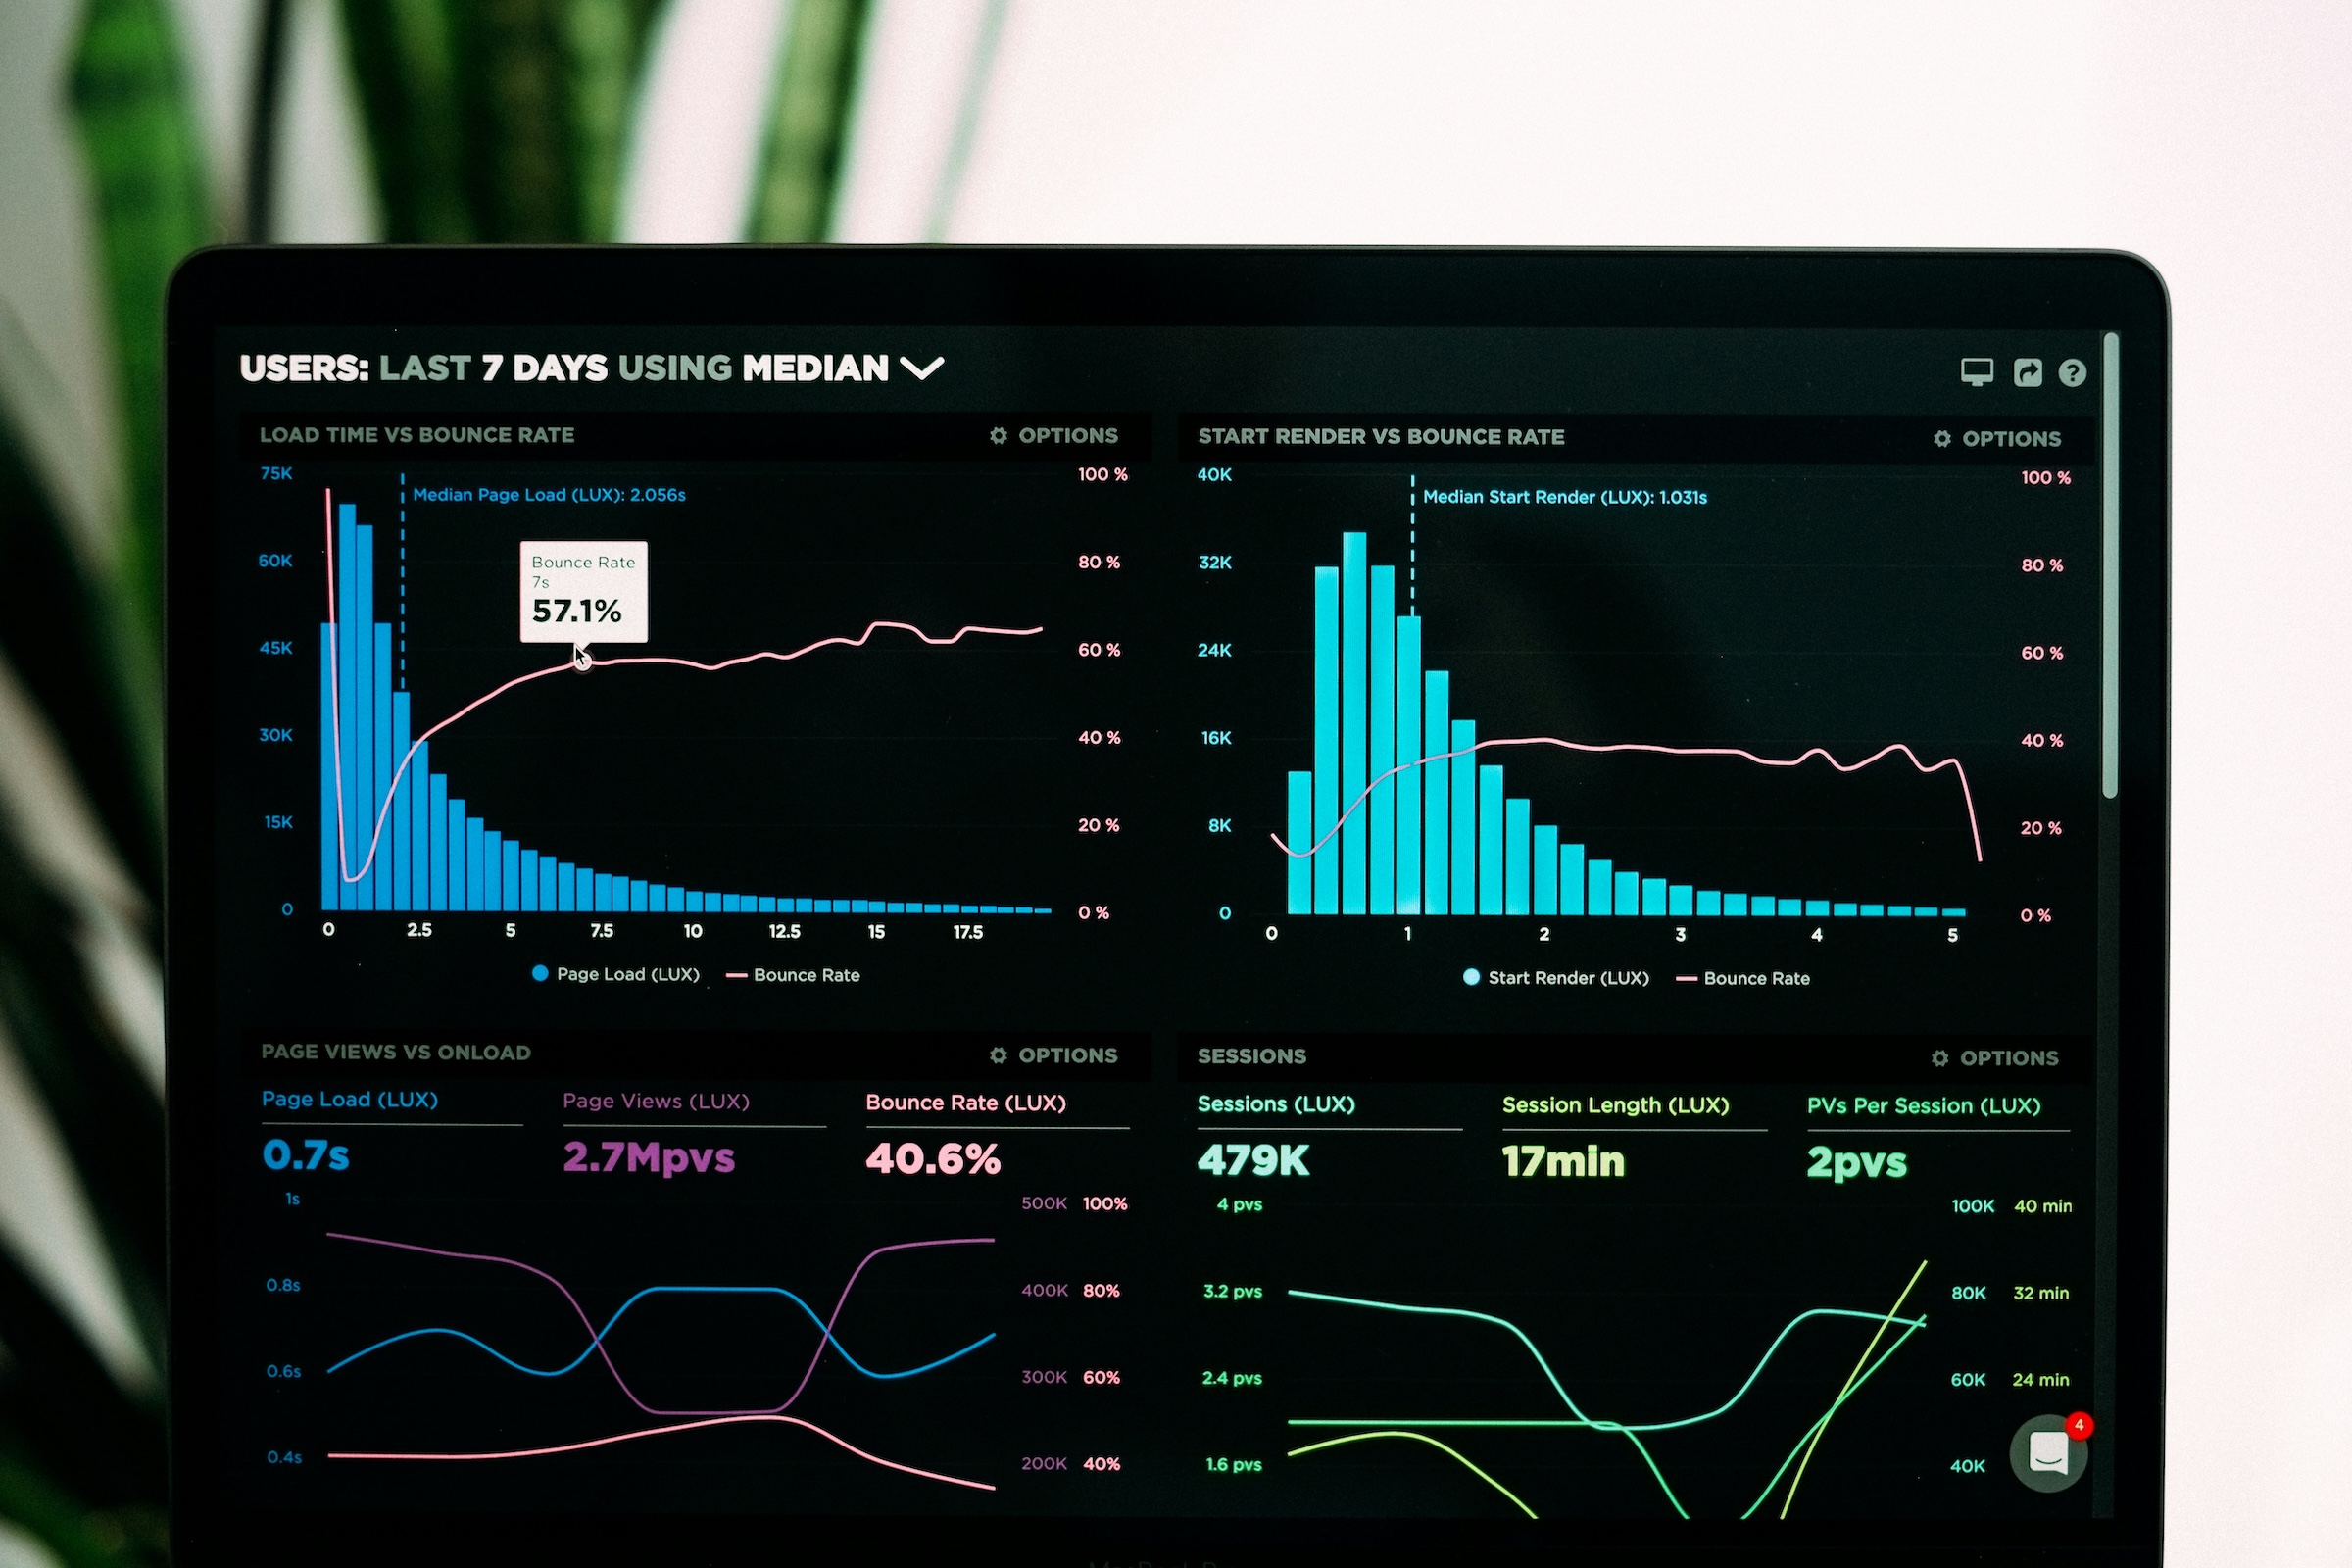
The monthly report is too late for many decisions
Finance and operations leaders often see the truth after the useful decision window has passed. Revenue leakage, delayed approvals, slow onboarding, stock issues, service bottlenecks and payment friction may all appear in reports, but only after teams have already absorbed the cost.
Traditional reporting explains what happened. Real-time operating analytics helps leaders see what is happening now, what is getting stuck, and what decision should happen next.
That distinction matters for UAE B2B companies trying to grow without adding unnecessary management layers. The faster the business moves, the more expensive delayed visibility becomes.
What CFOs need from AI-driven analytics
For a CFO, analytics should not only report financial outcomes. It should connect financial results to the operational behavior that creates them.
Useful CFO signals include:
- Which revenue opportunities are delayed because a proposal, invoice or approval is stuck.
- Which services create margin pressure because delivery effort is rising.
- Which customers, campuses, clinics, venues or business units are creating avoidable support cost.
- Which payment delays are caused by process friction rather than customer refusal.
- Which recurring exceptions are becoming operational risk.
AI can help by summarising patterns, flagging exceptions, classifying reasons for delay and connecting financial impact to workflow behavior.
But AI only helps if the data behind the workflow is trustworthy. That is why Data & Analytics should sit close to operational process design, not only finance reporting.
What COOs need from AI-driven analytics
For a COO, the key question is usually not "what is the number?" It is "where is the work slowing down, and what should we fix first?"
Useful COO signals include:
- Workload by team, role or location.
- Bottlenecks by workflow stage.
- Average response and resolution time.
- Exceptions that require manual intervention.
- Approvals waiting beyond agreed service levels.
- Customer or staff requests that repeat often enough to automate.
These signals help operations leaders decide whether to redesign a workflow, automate a step, change staffing, introduce a portal, or add AI support to reduce repetitive work.
The dashboard becomes useful because it points to action.
Why AI analytics must connect to workflow data
The strongest analytics does not come from manually assembled spreadsheets. It comes from work happening in structured systems.
When an inquiry, order, application, ticket, booking, onboarding task or approval moves through a defined workflow, the business naturally captures useful data: owner, timestamp, status, delay reason, exception type, outcome and next action.
AI can then help interpret those signals. It can identify patterns, summarise risk, highlight unusual movement and help leaders ask better questions.
Without workflow data, AI analytics becomes fragile. It may produce impressive-looking summaries, but those summaries depend on inconsistent inputs.
The executive view should be simple
Executives do not need every operational detail on the first screen. They need a clear view of what is healthy, what is stuck, what is changing and what needs a decision.
A practical executive analytics layer should show:
- Current operating priorities.
- Revenue or cost impact of delays.
- Exceptions that need escalation.
- Trends that affect capacity or margin.
- Workflow stages that repeatedly create friction.
- AI-generated summaries that explain why the signal matters.
The goal is not to replace leadership judgment. The goal is to reduce the time leaders spend hunting for the facts required to use that judgment well.
How Unilakes simplifies it
Conventional analytics projects often start with long reporting wish lists. That can produce dashboards, but not necessarily better decisions.
Unilakes starts with the decision. What does the CFO or COO need to know earlier? Which workflow creates the signal? Which data is missing? Which handoff is manual? Which exception should be visible? Which part can be automated?
From there, Unilakes can design the Data & Analytics, AI & Automation and Managed Transformation layers around the real operating question.
The result is not analytics theatre. It is a cleaner operating view that helps leaders act before problems become monthly-report surprises.
A practical place to start
Choose one executive metric that always arrives too late. It may be overdue invoices, delayed onboarding, missed follow-ups, support backlog, campaign conversion quality or service margin.
Then trace the number back to the workflow that creates it. If the workflow is manual, unclear or disconnected, that is the real analytics project.
AI-driven analytics starts there.